Visual Budget
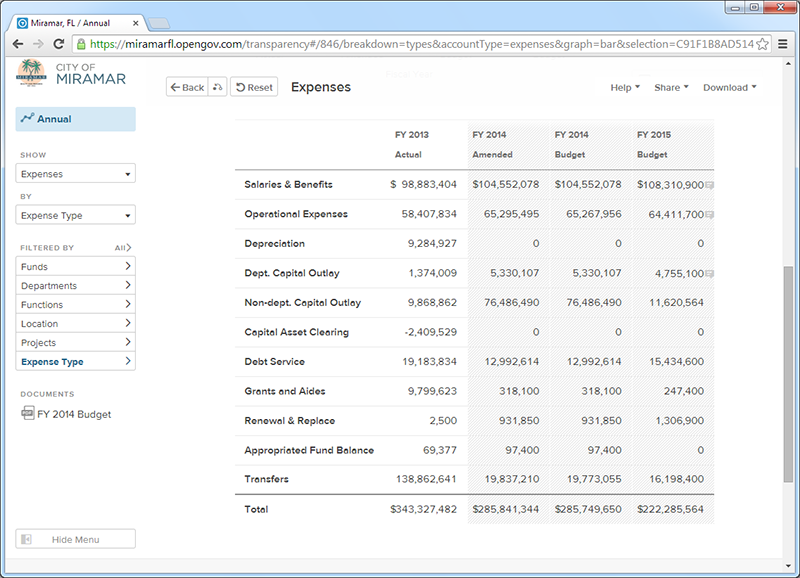
Welcome to Miramar’s Visual Budget platform. The application makes budget and financial information more accessible and easier to understand through the use of charts, graphs, simple filters and tables. Within the Visual Budget platform citizens can view, manipulate, drill down and report on financial data in a graphical manner by way of line graphs, pie charts, bar charts and data tables.
The data includes Annual, Current Year Monthly and Budget to Actual Monthly reports starting with Fiscal Year 2013 through present. The Annual report displays annual actuals and the current year Adopted Budget. The Current Year Monthly report displays monthly actuals. The monthly data can be viewed by selecting a specific month. The Budget to Actual Monthly report displays actuals for each month within the fiscal year. This report also displays the Revised Budget and Adopted Budget for the fiscal year. The report can be viewed by selecting a specific fiscal year. The City has provided this functionality to its citizens in an effort to become more transparent and engage all stakeholders to actively participate in city government.
This application supplements the annual budget publications that are published electronically on the City of Miramar’s website as well as the city’s Comprehensive Annual Financial Reports and the city’s Capital Improvement Program (CIP).


